While Mumbai saw a three-fold increase in infections during the second wave, some populous wards in western suburbs saw more than four times the cases they had in first wave
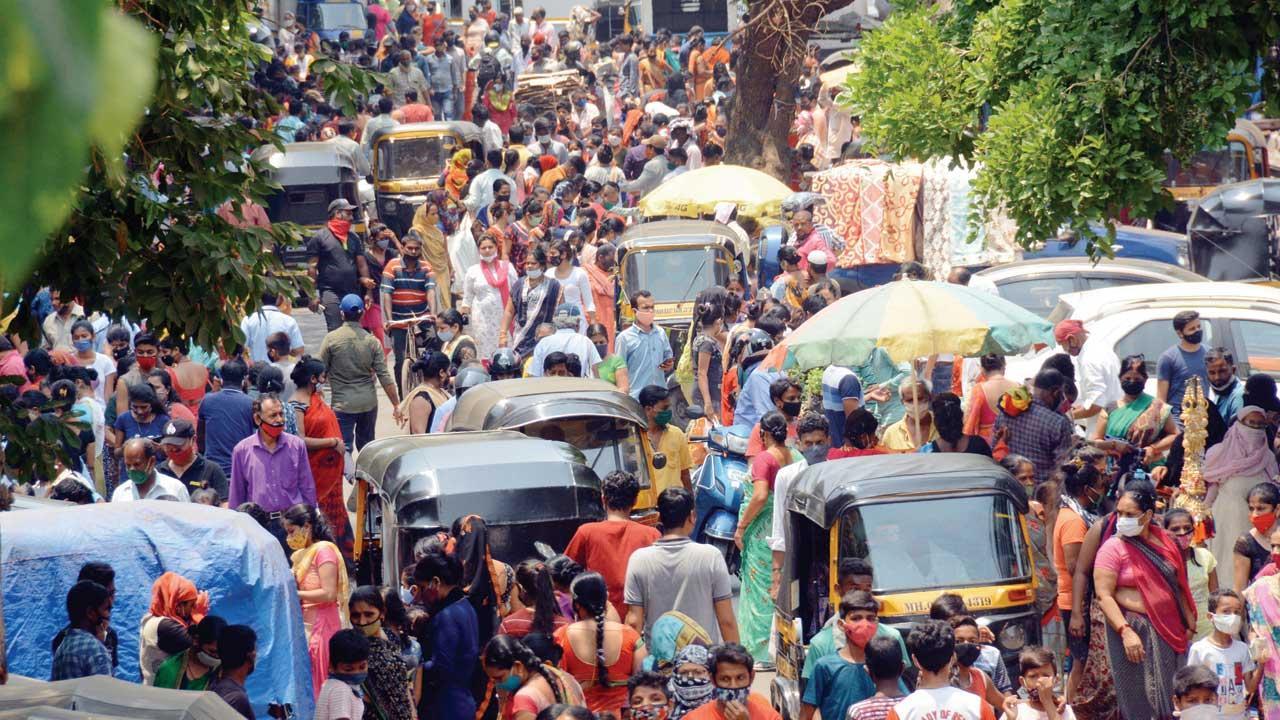
Many people, seen without masks worn properly, throng the weekly bazaar at Poisar, Kandivli (R south ward) on February 2. Pics/Satej Shinde
The number of active Covid-19 cases in all wards increased almost three-fold in the peak of the second wave, in comparison to the peak of the first wave. Goregaon (P-south) and Bandra West (H-West) have seen a sharp growth, more than four folds of the previous one. The growth rate is higher in the wards which have more people residing in high-rises, and though Malad (P-North), Kurla (L ward) have also recorded high number of cases compared to the first wave, the cases in these slum dominated wards also came from high-rises. It is also seen that the same seven wards that were hit hard in the first wave, were hit hard in the second wave (these are the first seven wards in the table below right).
ADVERTISEMENT
People shop for Gudi Padwa on April 12 at Borivli (R Central)
The second wave, however, may be on the decline in Mumbai. The highest number of cases recorded on April 11 and the peak of the active cases was 92,464. It is almost three times higher than the first wave when on September 18, 2020 the active cases were 34,136. The rise in the number of cases across the wards is also related to population density. The Western suburbs from Borivli to Bandra and eastern suburbs, especially with more buildings, like Ghatkopar (N ward), Mulund (T ward) had more cases. On the contrary, a ward like B that comprises Dongri, Bhendi Bazaar-like densely populated areas and M east that comprises large slums of Deonar and Govandi registered fewer cases just like in the first wave.
Also Read: COVID-19 in Mumbai: 90 per cent new cases are in high-rises
K West topped the cases
K West (Jogeshwari west, Andheri west, Vile parle west) is at the top of the chart in the second wave. During the first week of April, more than 5,000 cases were reported in seven days from the ward. Its neighbouring ward K East (Jogeshwari east, Andheri east, Vileparle east) also had a higher number of cases. PN (Malad) ward with around 10 lakh people reported a higher growth in the second wave also and here also the maximum cases are from buildings. The most growth can be seen in P south (Goregaon) and H west (Bandra west, Khar west, Santacruz west). With a 3.18 lakh population, Bandra had 807 active cases on September 18 and on April 12 they rose to 3,842, a four and a half fold rise. Similarly in P south where there were 1,148 active cases in the peak of the first wave, 5,142 tested positive in the peak of the second wave. But in M east, B ward areas where 99 per cent area is covered by slums and congested structures, the number of cases was much lower than the other wards.
Sonawala Building at Marine Drive where a banner was put up by BMC declaring the building a containment area in March. Pic/Suresh Karkera
Officials speak
Vishwas Shankarwar, deputy municipal commissioner of zone 7 comprising the Dahisar to Kandivli belt, explained, “In the second wave the virus is more contagious and spread rapidly. People were not observing Covid-19 protocols after the cases went down in December and January. Marriage and other functions started and the cases started to shoot up in February.” He added that the cases were mainly from buildings and the trend remains till now. Dahisar has a large slum area, so the proportion of cases is 80:20, 80 per cent from buildings and 20 per cent from slums. In Kandivli where 50 per cent population stays in slums, 85 per cent cases emerged from high-rises, and in Borivli 90 per cent to 95 per cent of cases were registered in a higher class locality.
Kurla (L ward) is the second-largest ward in the city in terms of population after Malad (P North). At least 9.33 lakh people stay in the ward and out of these barely 15 per cent reside in buildings. “But even in April, at the peak of the pandemic, 90 per cent to 95 per cent cases were from buildings. These people stayed put in their houses during the first wave and as the lockdown curbs eased, they started going to offices, nearby resorts without precautions, which may have resulted in a higher number of cases,” said Manish Valanju, assistant commissioner of L ward.
7,531
No. of active cases in K West, which tops in second wave
2,128
No. of active cases in K West in the first wave
92,464
No. of active cases in city in second wave on Apr 11
5,142
Cases in P South on Apr 12, highest after the 7 wards